Actions
Task #208
closed
Prepare and process Indian Ocean Tuna Commission catch statistics
Start date:
Jun 03, 2015
Due date:
% Done:
100%
Estimated time:
Infrastructure:
Production
Description
In order to support and promote processing of stock assessment data in BlueBridge, we were requested to analyse tuna catch statistics and demonstrate the capabilities of the e-Infrastructure.
This ticket will report the preparation and processing activity required to extract indicators and trends from data published by the Indian Ocean Tuna Commission (an IRD stakeholder), and to demonstrate the D4Science capabilities in this domain.
Files
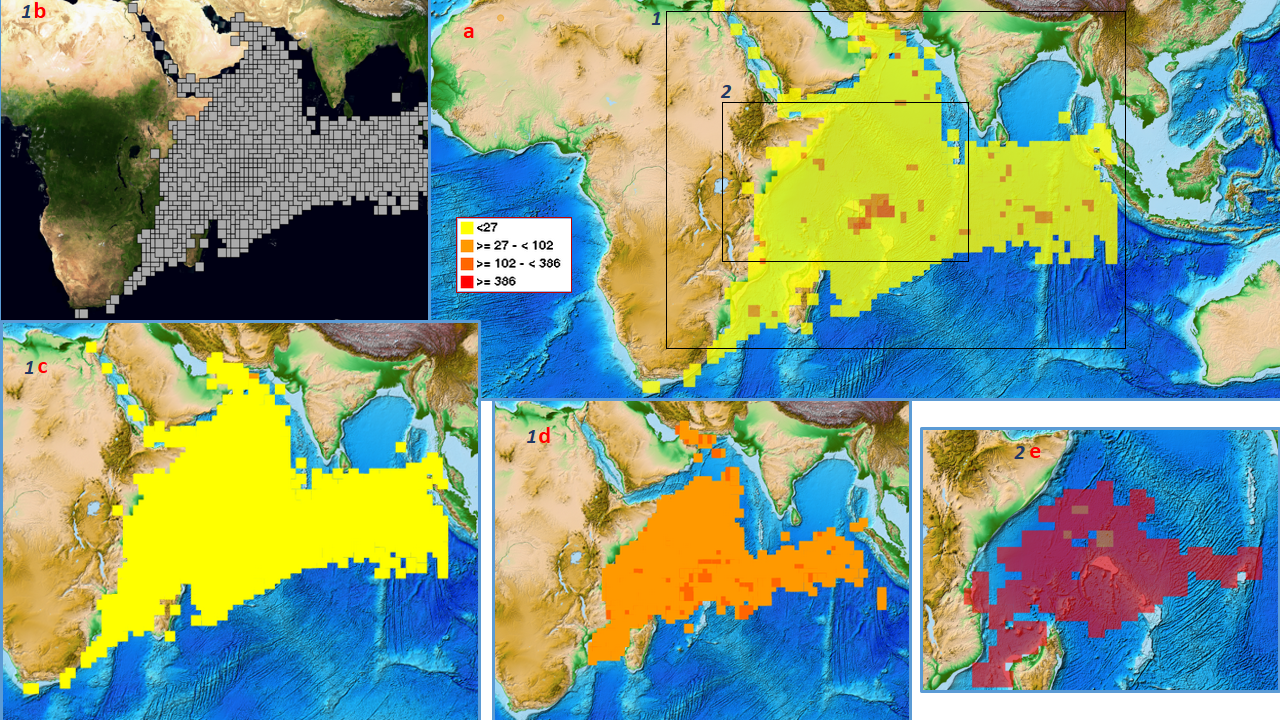
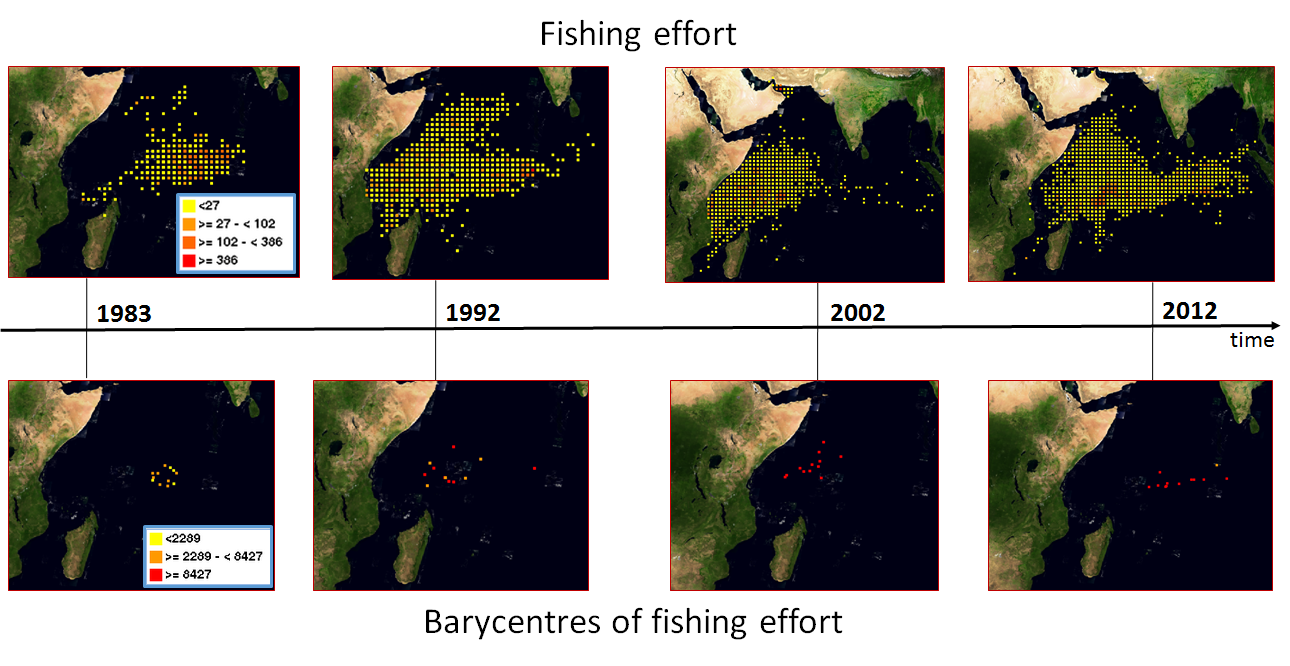
| Figure1.png (2.31 MB) Figure1.png | Distribution of fishing effort locations with enlargements focusing on different ranges of fishing rate | ||
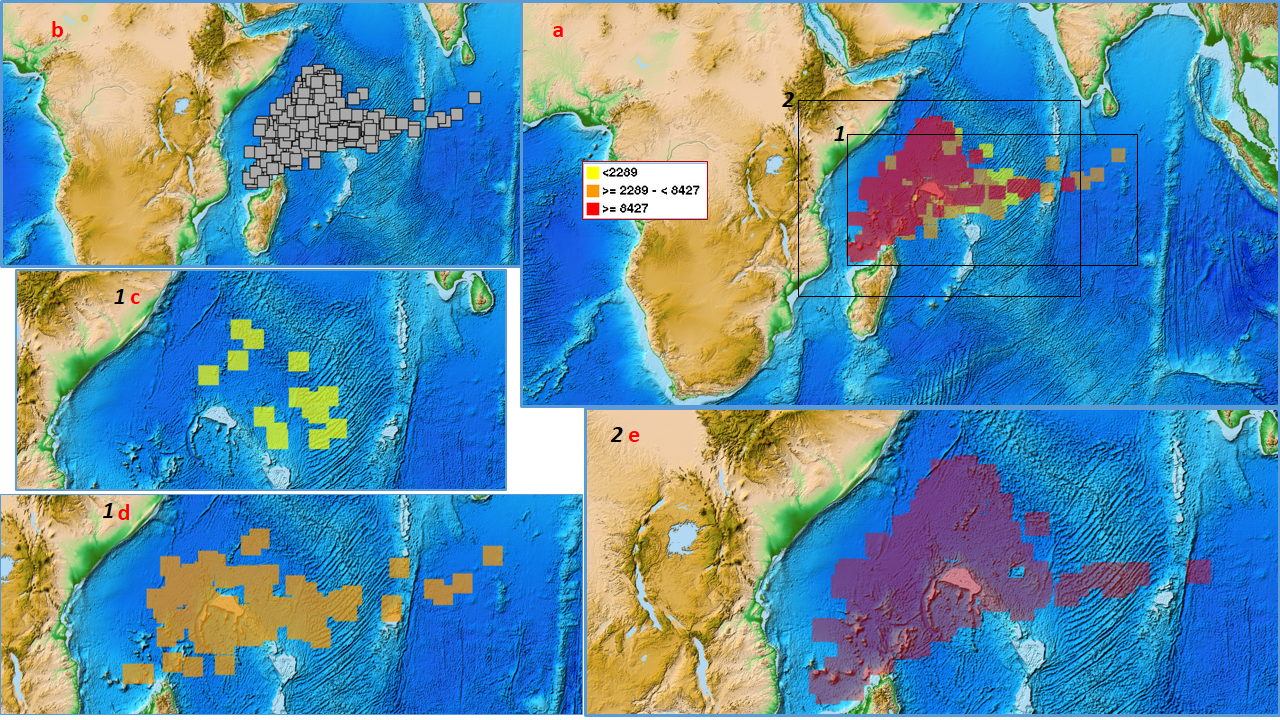
| Figure2.png (2.65 MB) Figure2.png | Distribution of barycenters fishing effort locations with enlargements focusing on different ranges of fishing rate | ||
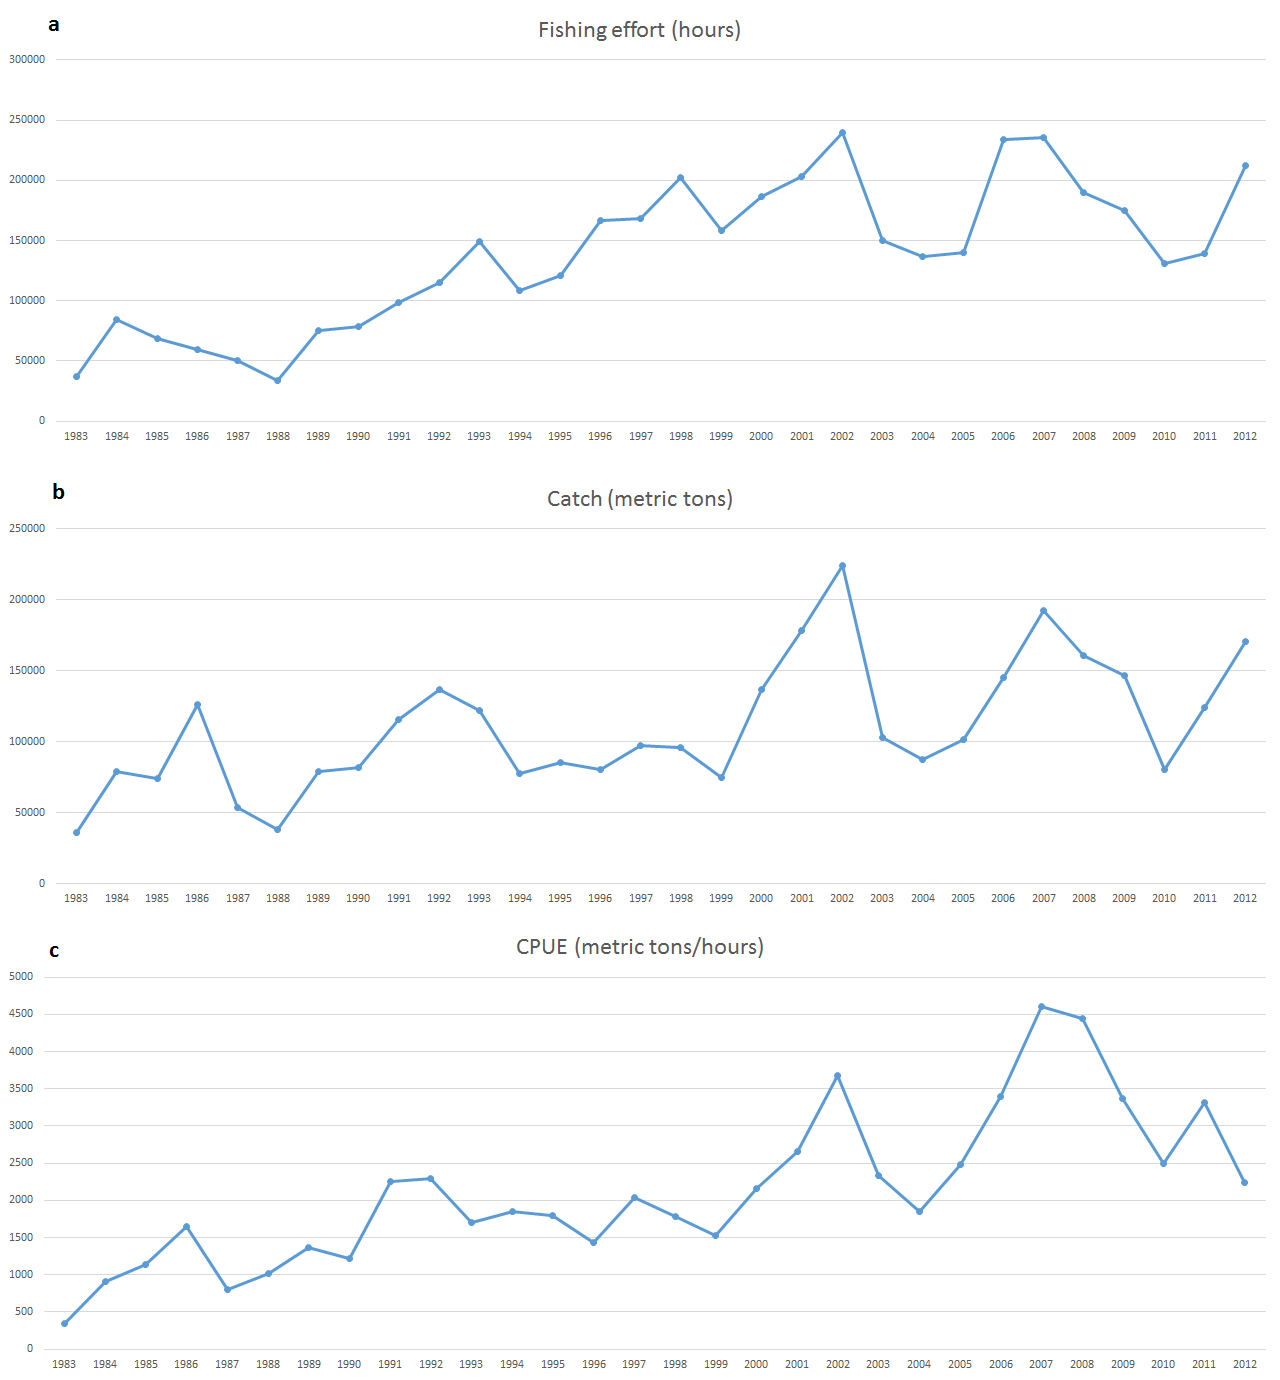
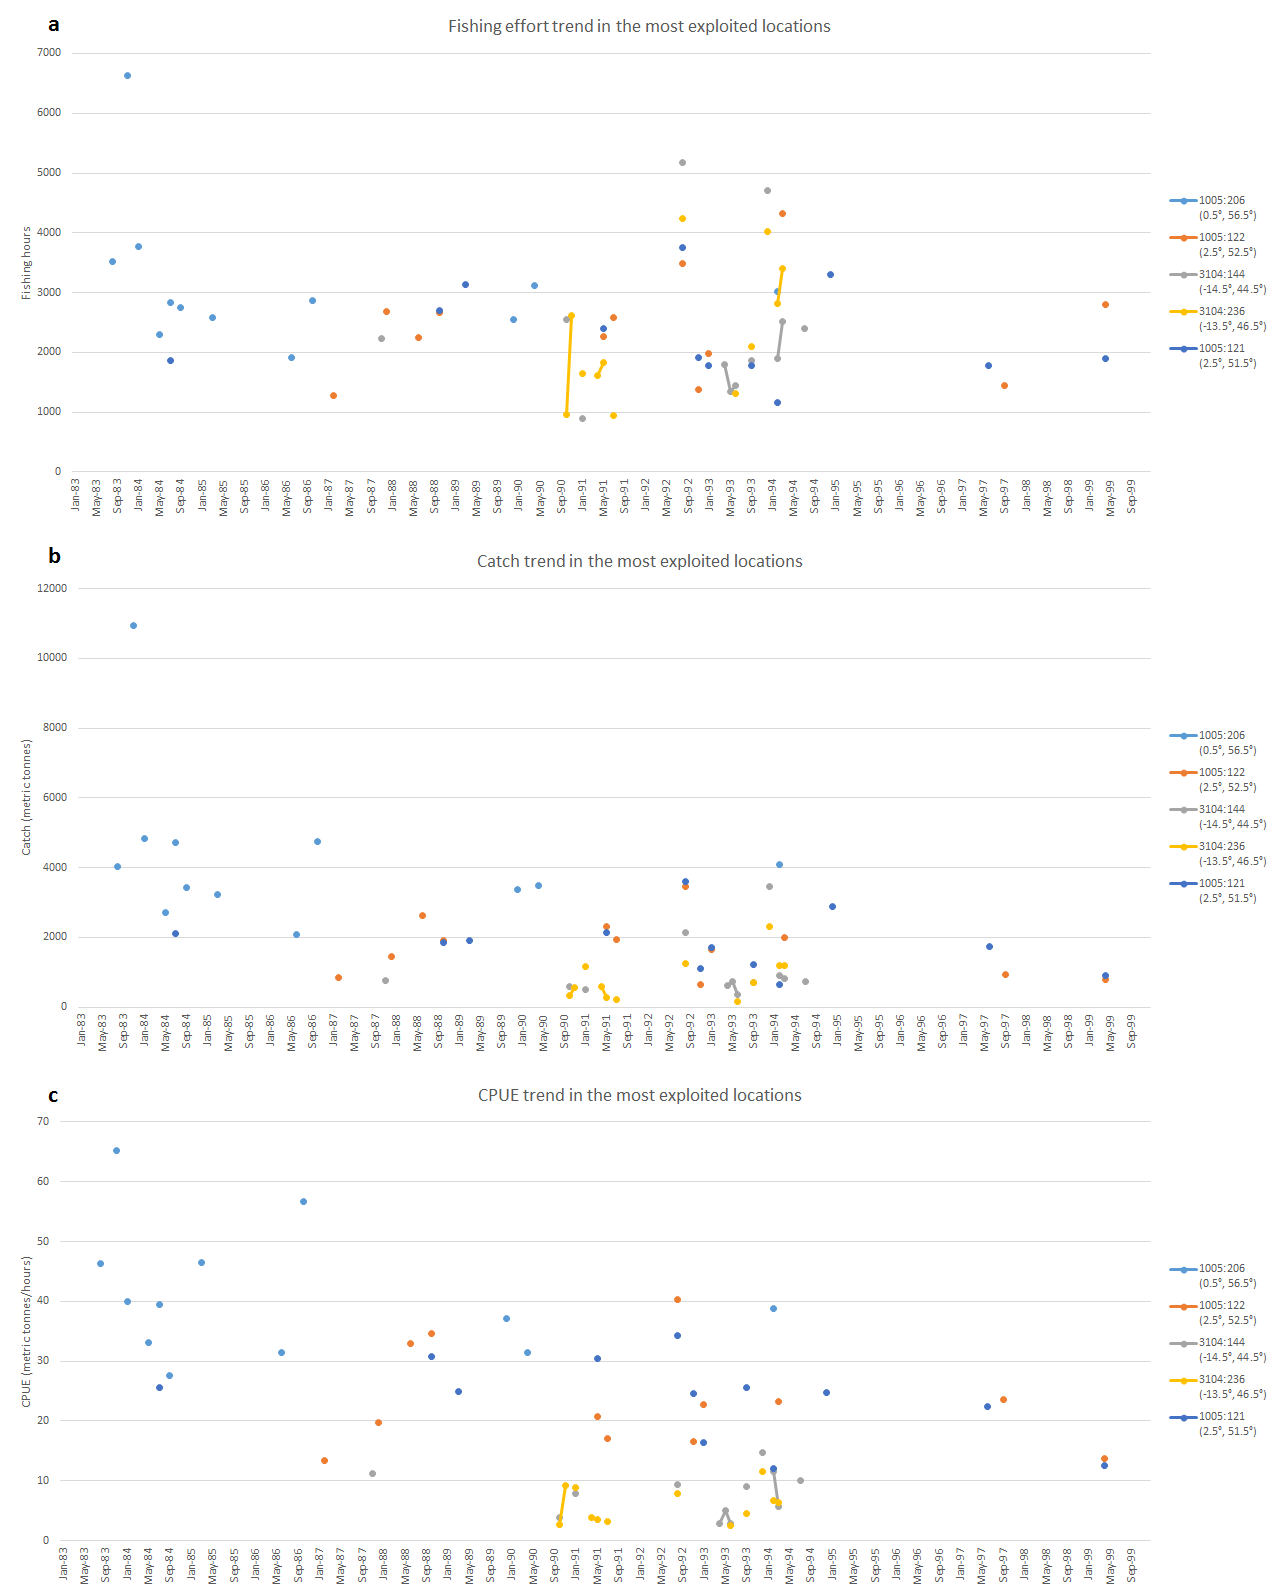
| Figure4.png (58.9 KB) Figure4.png | Annual trends of fishing hours, catch and CPUE | ||
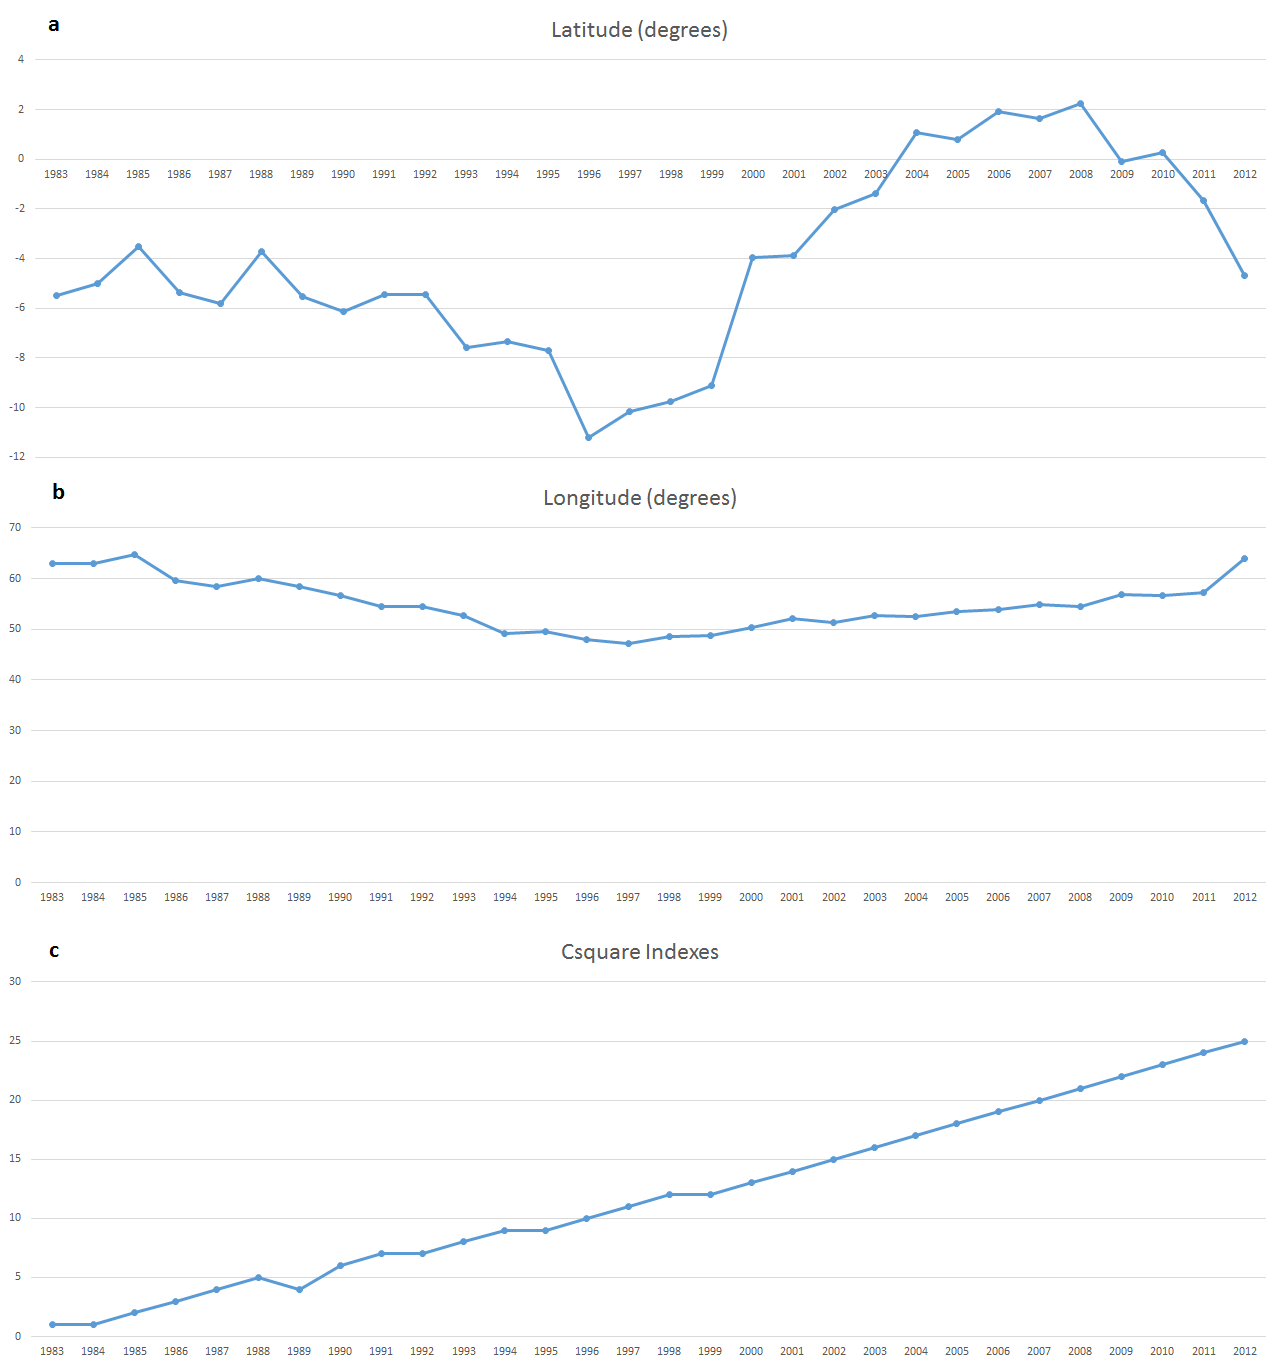
| Figure6.png (44.9 KB) Figure6.png | Annual trends of longitude, latitude and csquare indexes | ||
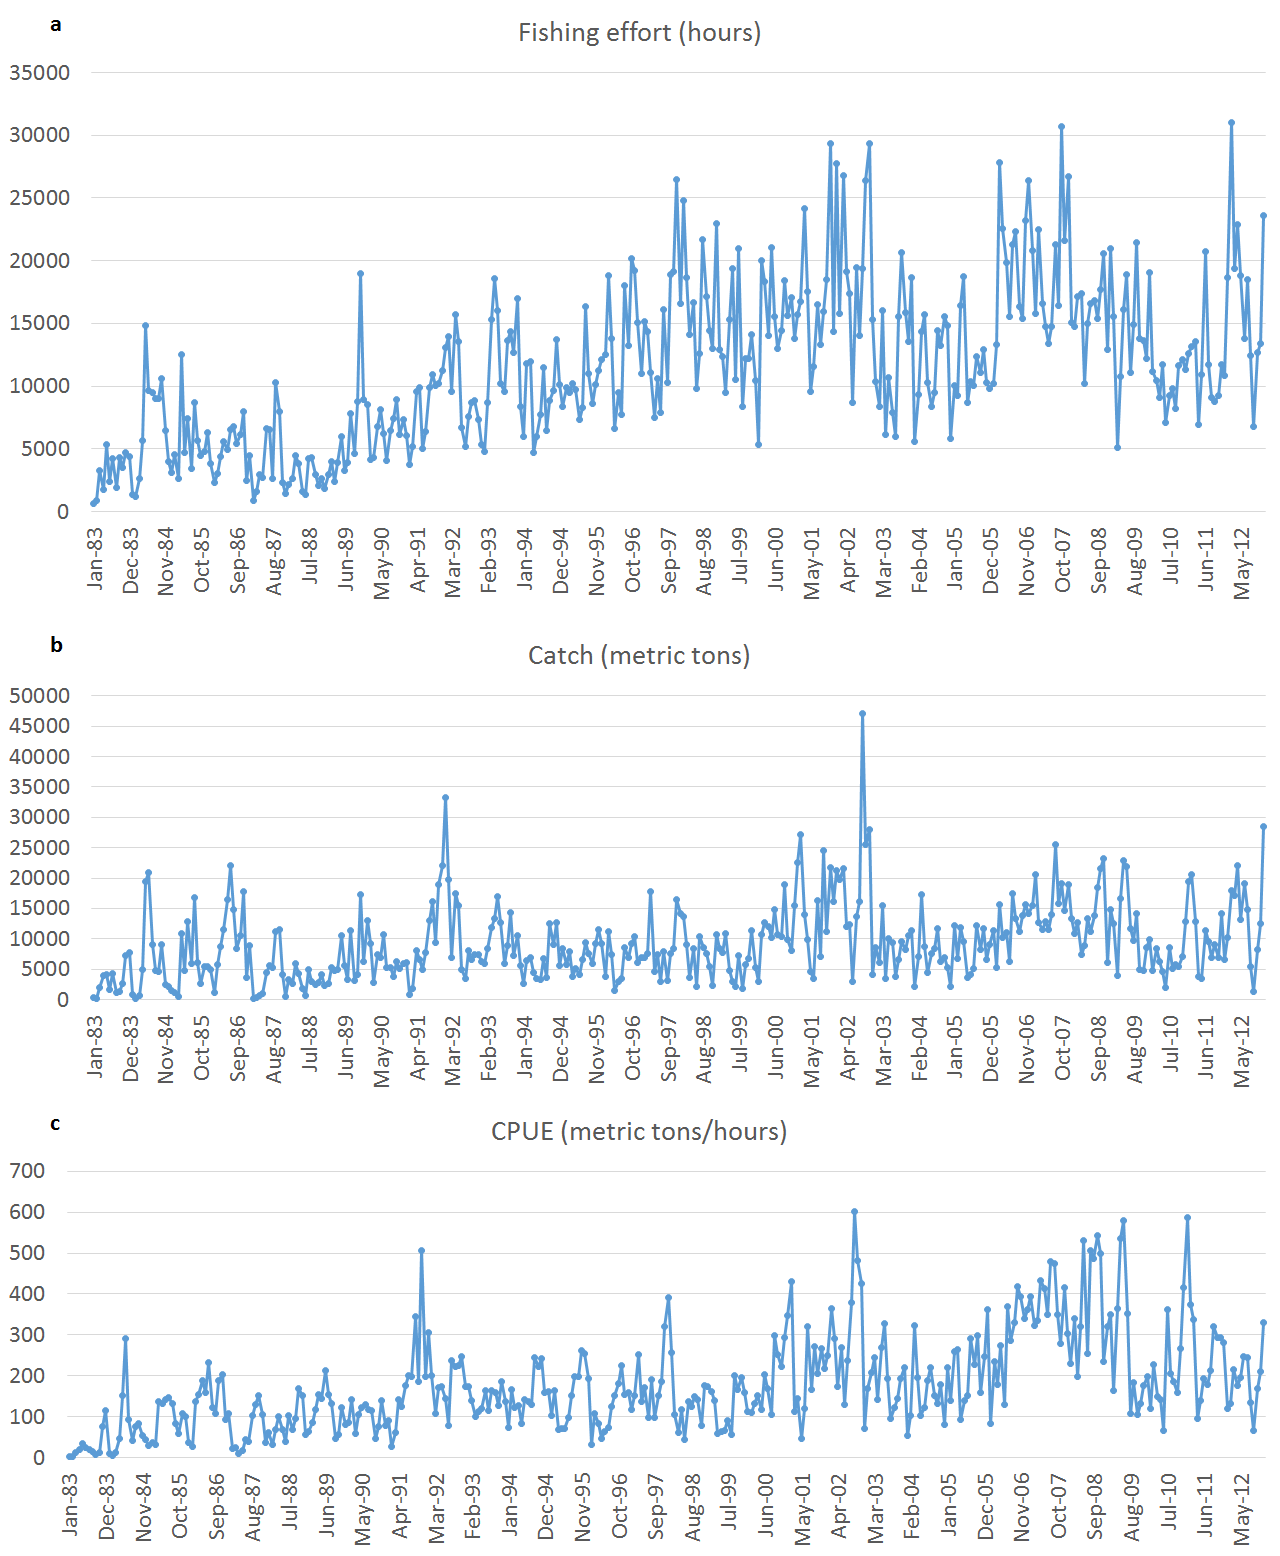
| Figure3.png (194 KB) Figure3.png | Monthly trends of fishing effort, catch and CPUE | ||
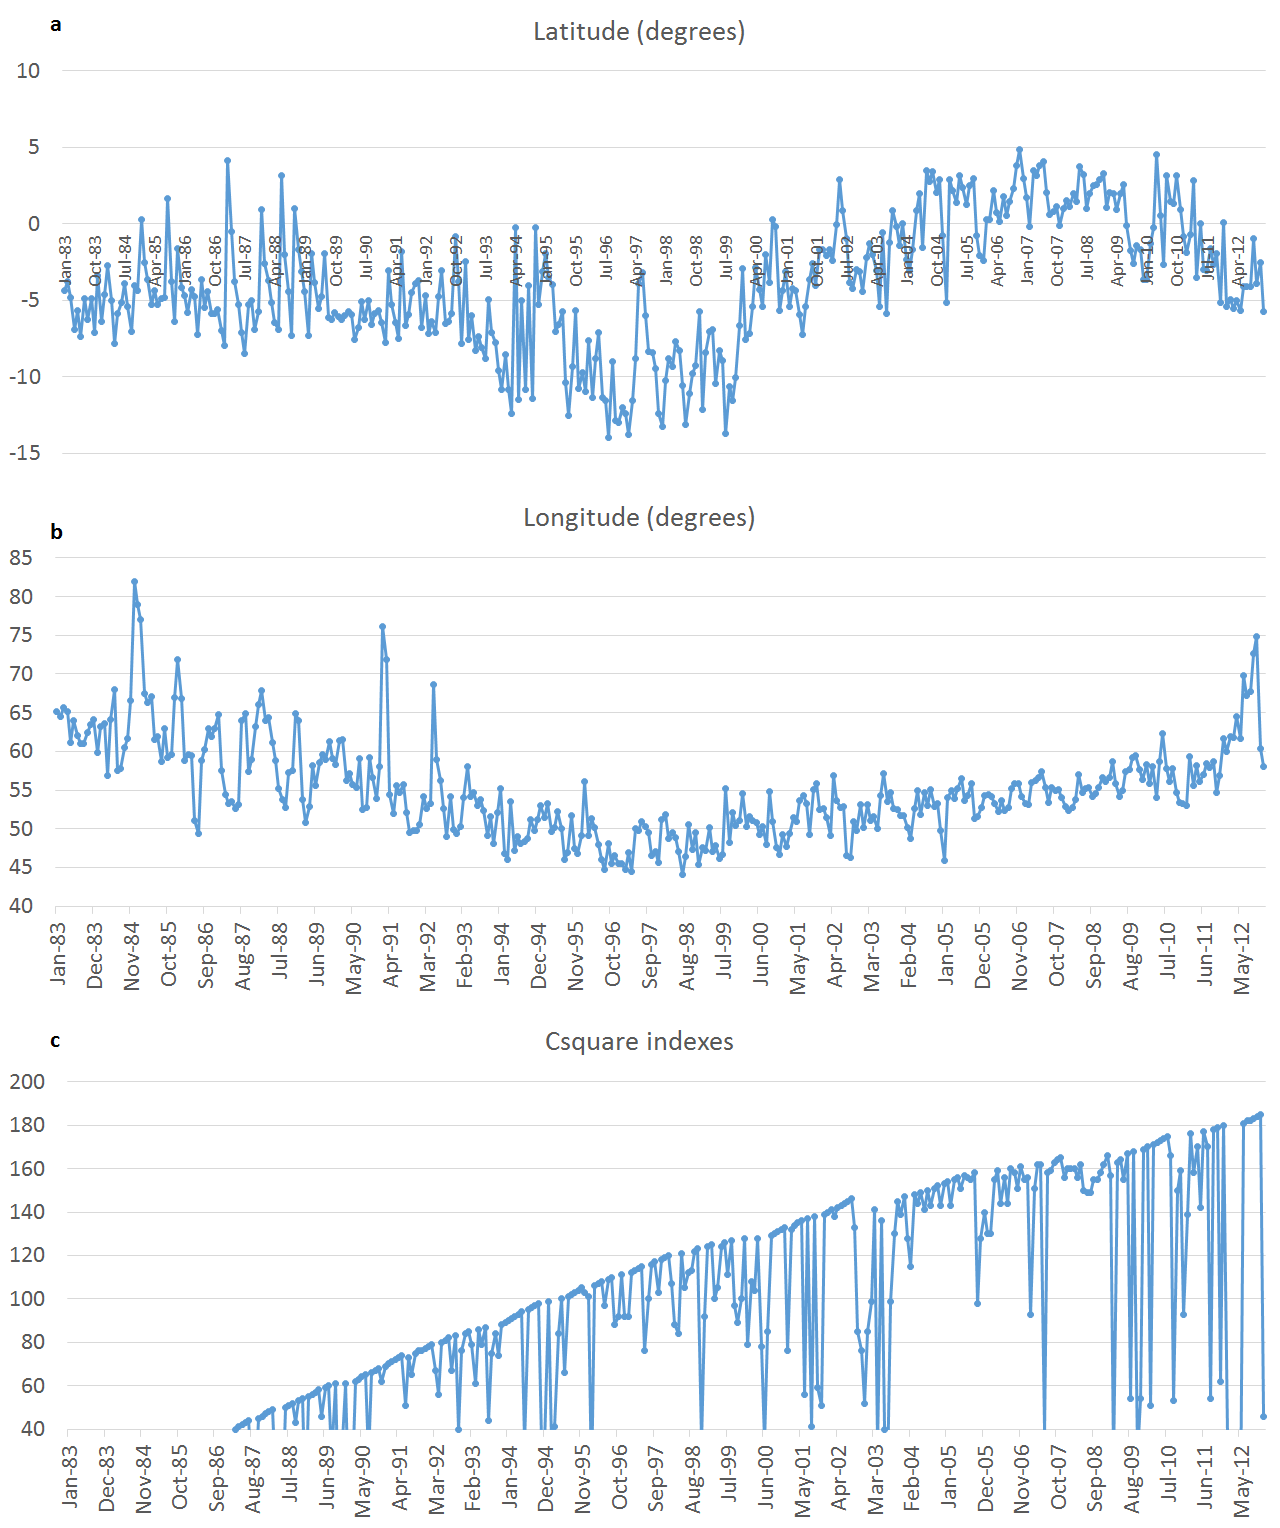
| Figure5.png (175 KB) Figure5.png | Monthly trends of latitude, longitude and csquare indexes | ||
| Figure7.png (597 KB) Figure7.png | |||
| Figure8.png (38.9 KB) Figure8.png | |||
| Figure9.png (50.9 KB) Figure9.png | |||
| Table 1.xlsx (14.2 KB) Table 1.xlsx | Inner periodicities of the trends | ||
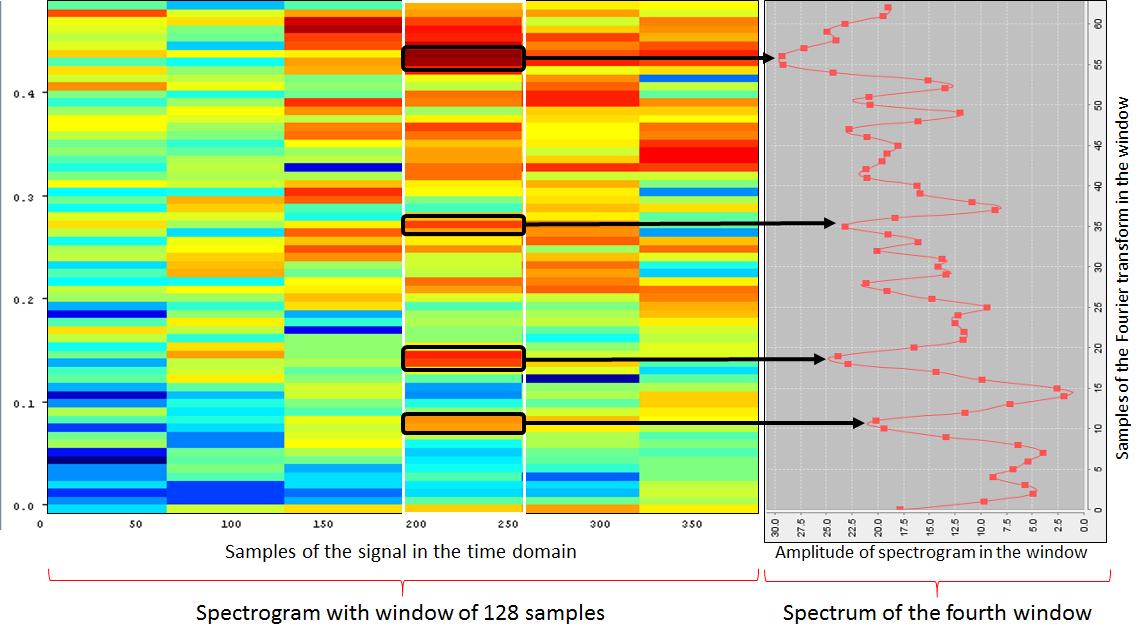
| Figure10.png (92.2 KB) Figure10.png | Example of spectrogram of the fishing effort with analysis window length of 128 samples | ||
| Figure11.png (244 KB) Figure11.png | |||
| Figure12.png (118 KB) Figure12.png | |||
| Figure13.png (770 KB) Figure13.png | |||
| Table 2a.xlsx (9.72 KB) Table 2a.xlsx | |||
| Table 2b.xlsx (9.04 KB) Table 2b.xlsx | |||
| Table 3.xlsx (9.7 KB) Table 3.xlsx | |||
| ForecastingTimeSeriesAbstract 2.0.docx (14.3 KB) ForecastingTimeSeriesAbstract 2.0.docx |
 Updated by
Actions

